This case study presents an Operational Modal Analysis made with the Crystal Clear Stochastic Subspace Identification algorithm available in ARTeMIS Modal Pro. This algorithm is developed in cooperation with our strategic partner – the French Institute National de Recherche en Informatique et en Automatique (INRIA). This algorithm can be applied for both single and multiple setup measurements. In the present case study, the measurement campaign is divided into 28 test setups.
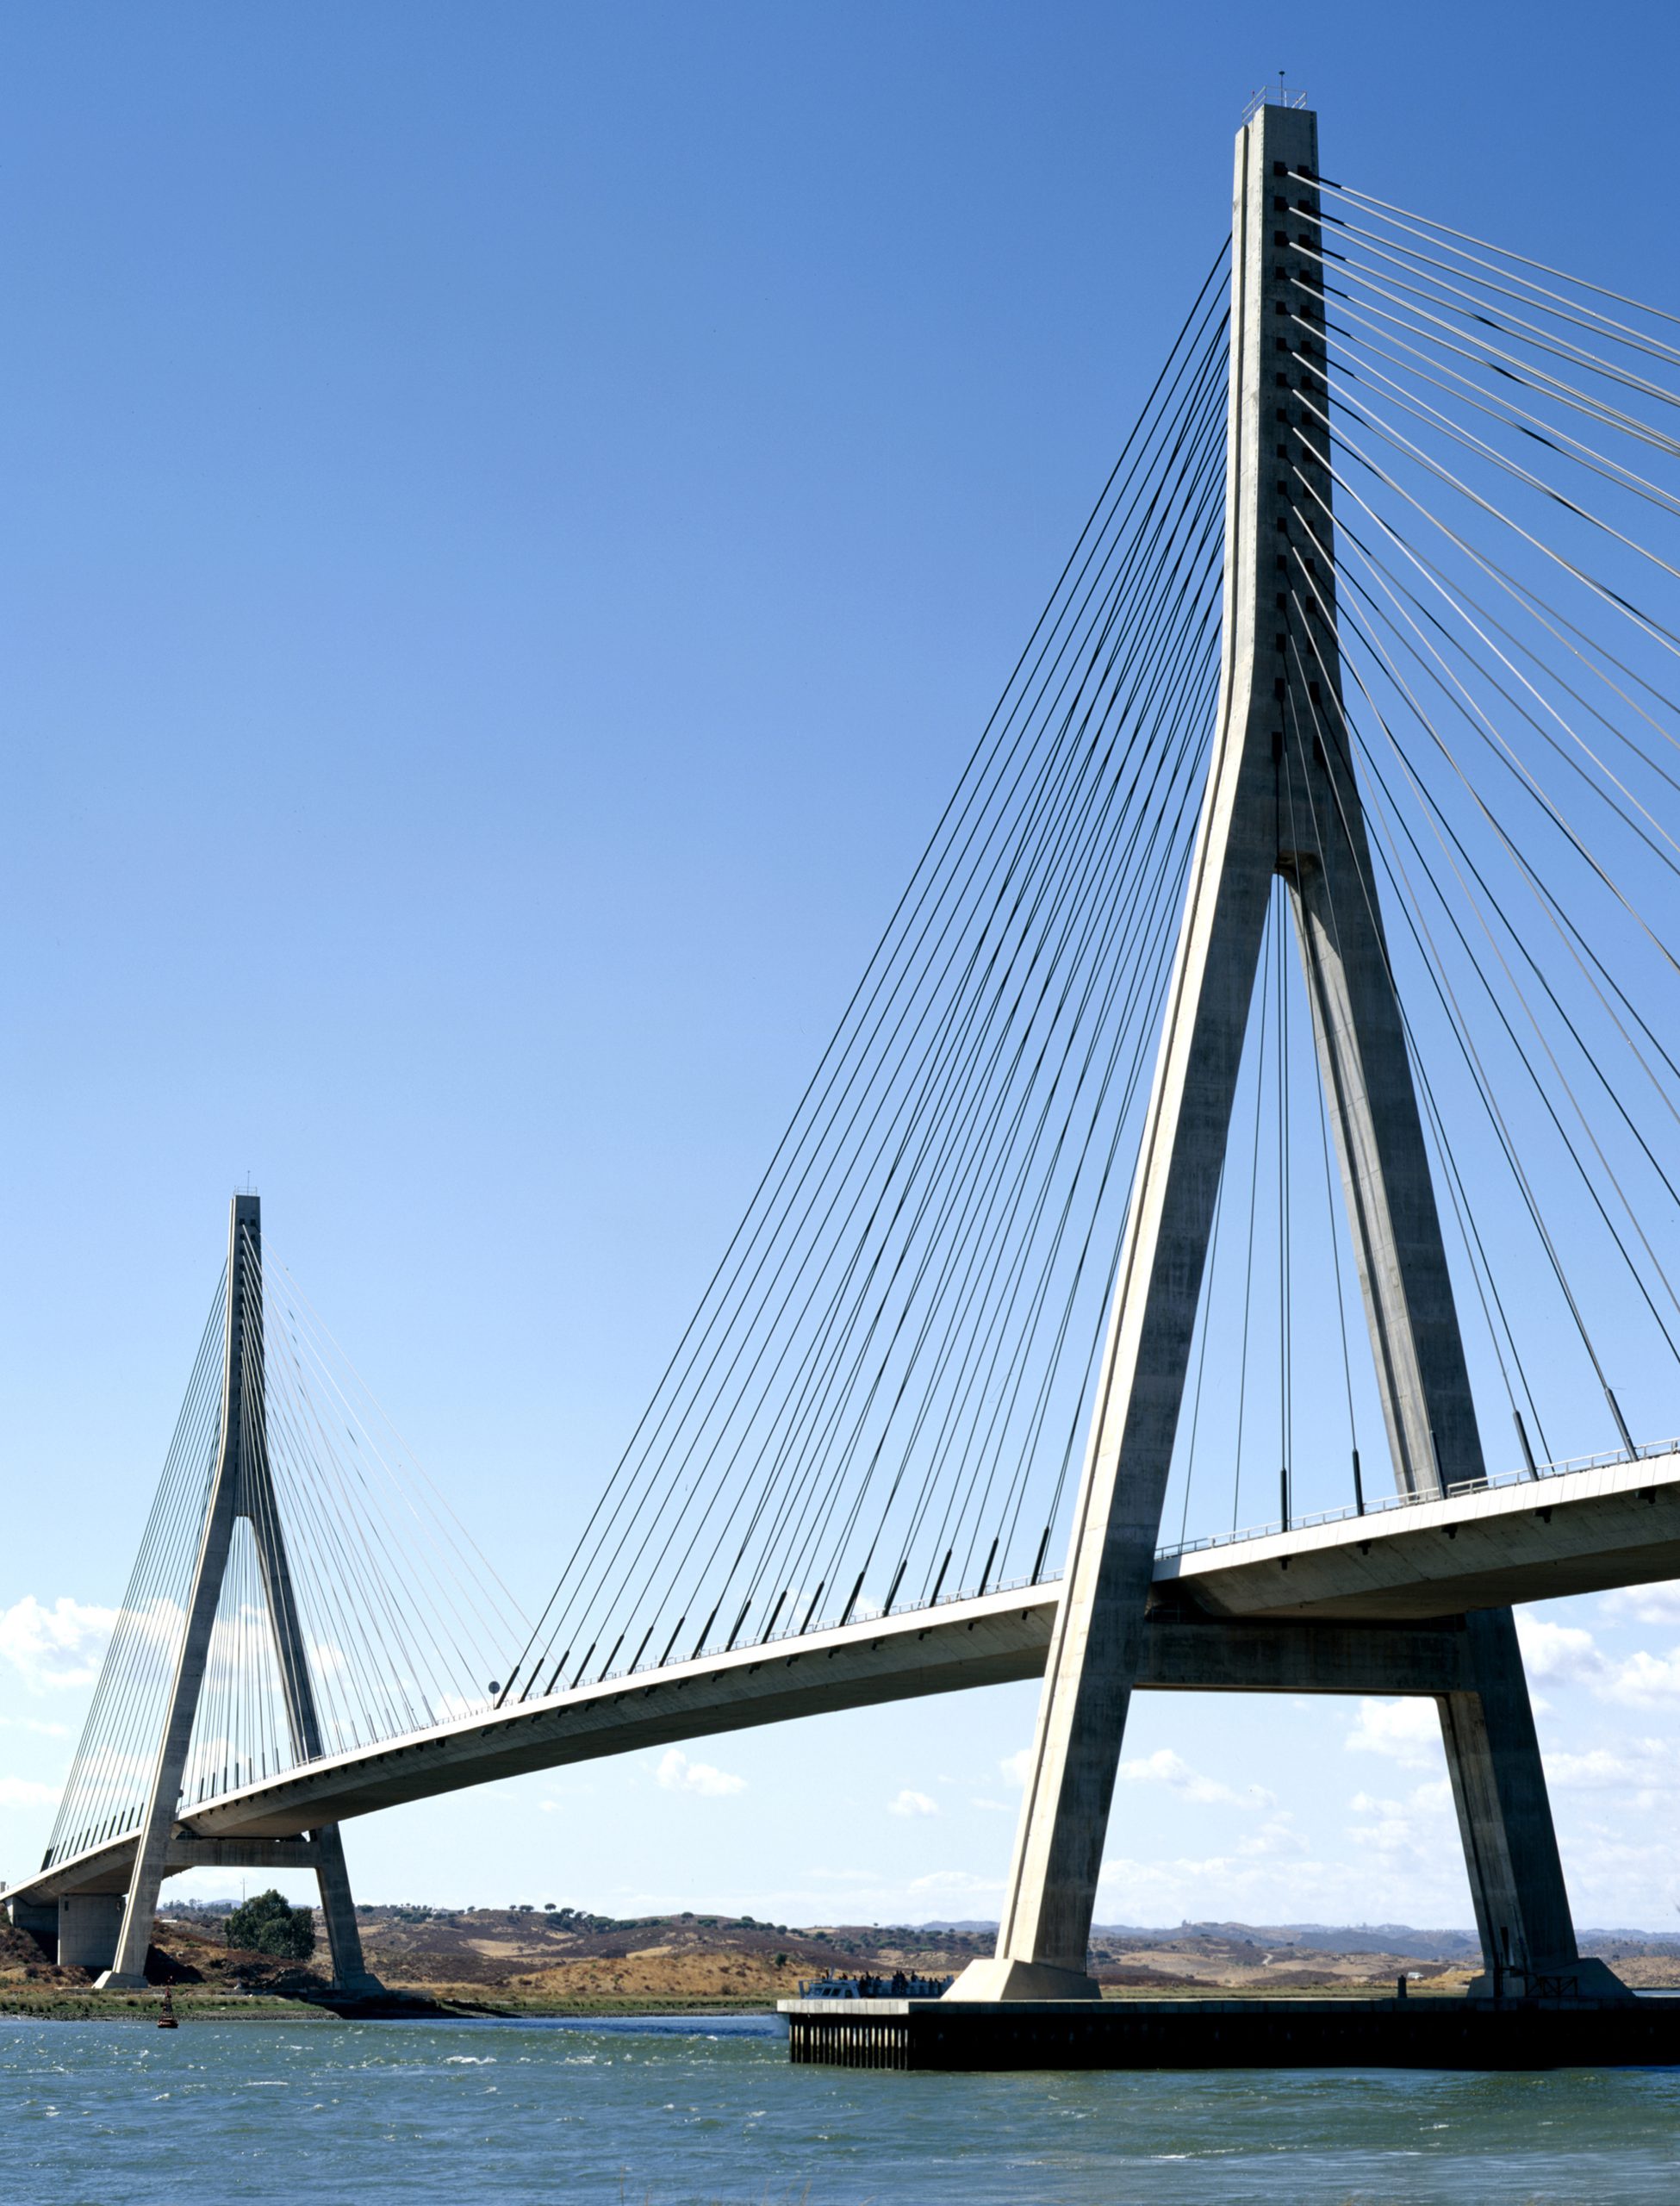
The International Guadiana Bridge is a concrete cable-stayed bridge, located in the southeast of Portugal, connecting Portugal and Spain over the Guadiana River. The bridge, designed by the Portuguese engineer Câncio Martins, was open to traffic in 1991 and was one of the first cable-stayed bridges with a moderate span constructed in Portugal.
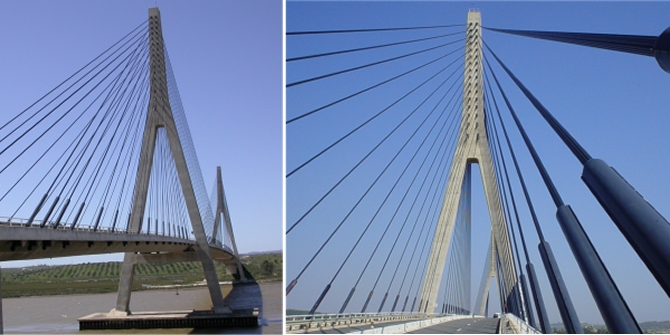
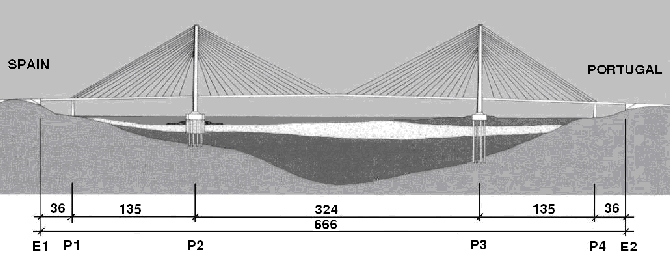
The bridge is composed of a central span of 324 m, two lateral spans of 135 m and two transition spans of 36 m, resulting in a total length of 666m. The deck is a prestressed concrete box section, 18m wide and 2.5m high, with internal concrete bracings at 4.5m intervals. It is supported at the towers and suspended by stay-cables. These are arranged in a semi-fan, in a total of 32 pairs anchored at the top of each tower and at the deck at 1.8m and 9m intervals, respectively. The two A-shaped concrete towers, which provide vertical and lateral supports for the deck, are 100m high and are supported by pile groups, with 2.0m diameter piles, founded on schist rock.
The measurements have been made by Professors Alvaro Cunha, Elsa Caetano and Filipe Magalhães, Faculdade de Engenharia da Universidade do Porto, Laboratory of Vibrations and Monitoring (http://paginas.fe.up.pt/vibest/), Porto, Portugal.
The considerable extension of the bridge makes the use of cables rather cumbersome and time consuming. Therefore, 4 triaxial 18-bit strong motion recorders were used in the present application. These devices are constituted by very sensitive internal force balance accelerometers (linear behaviour from DC to 100 Hz), 18 bit analog-to-digital converters (to guarantee high sensitivity), batteries that enable autonomy for one day of tests, memories materialized by removable Compact Flash cards that permit a fast download of the acquired data and external GPS sensors to ensure an accurate time, so that they can work independently and synchronously, avoiding the use of cables and minimizing the labour associated with the preparation of the dynamic test.
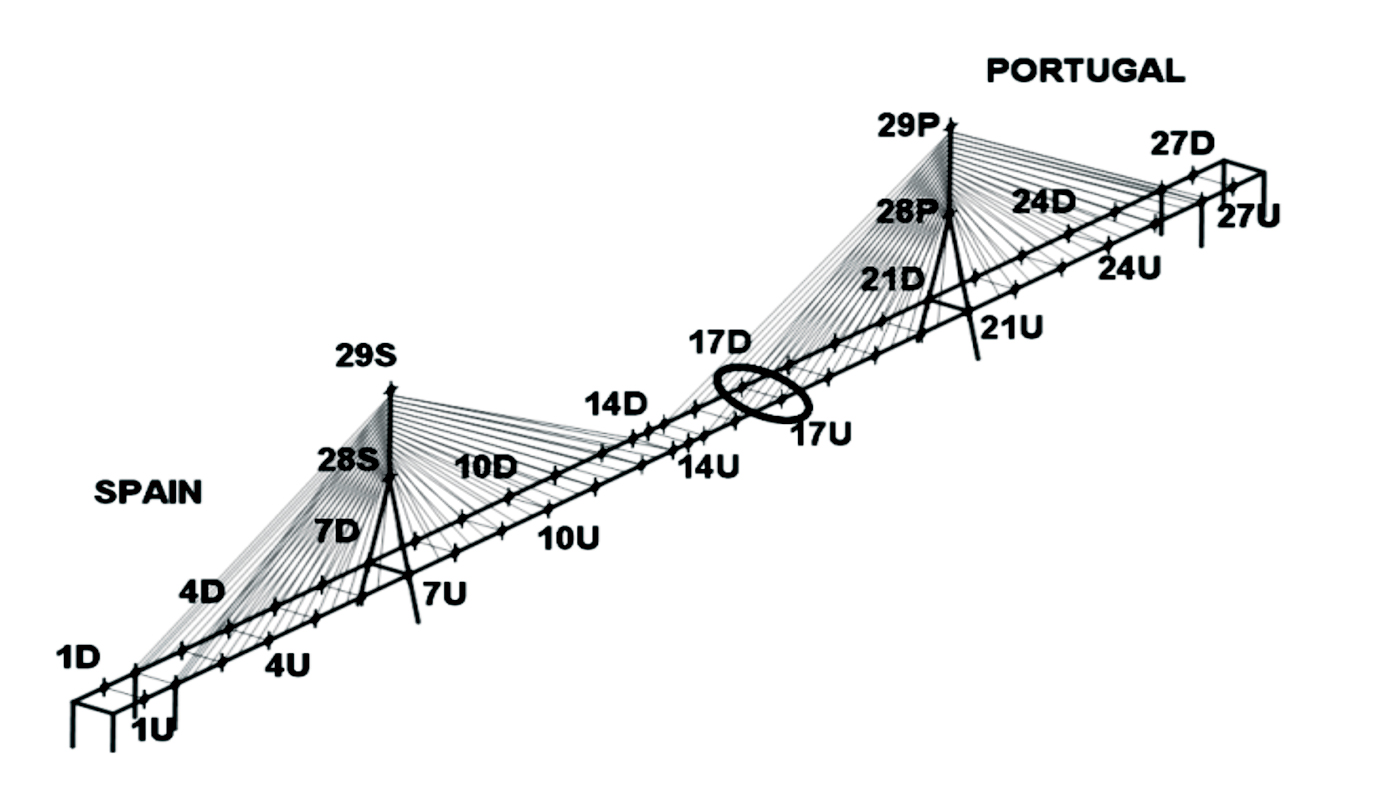
In the ambient vibration test of the International Guadiana Bridge, two recorders, permanently located at section 17 (see Figure 4) on both sides of the deck (locations 17U – upstream and 17D – downstream), served as references. The other two recorders scanned the bridge deck and towers in 28 consecutive test setups, measuring the acceleration along the 3 orthogonal directions in all the points represented in Figure 4. For each test setup, time series of 21 minutes (1260 seconds) were collected, corresponding to approximately 500 cycles of the longest vibration period of the structure. The sampling frequency was 100 Hz, value that is imposed by the filters of the acquisition equipment and that is much higher than necessary in the test of a cable-stayed bridge, where the most relevant natural frequencies are below 3 Hz.
After uploading the 28 test setups, the measurements were decimated to a new frequency range with a Nyquist frequency of 2.5 Hz. The Common SSI matrices were estimated using a Max. Dimension of 150 and the Stabilization Diagrams were estimated using Crystal Clear SSI estimator. Below, the Stabilization Diagram for test setup 9 is shown. It displays the Singular Values Decomposition (SVD) of the Spectral Densities of the measurements in the background. In front, the natural frequencies of stable modes of the 150 different state space models are presented in red.
Due to the extremely clear stabilization diagrams, the Automatic Mode Estimation feature was able to find 10 global modes.
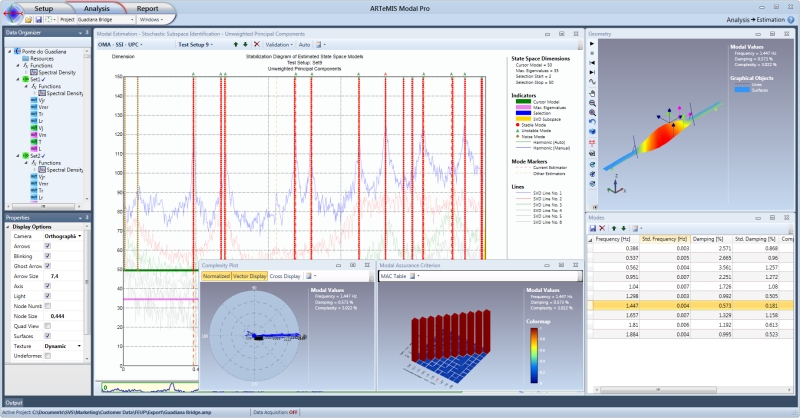
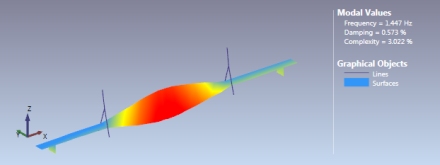
Stabilization Diagram of the Crystal Clear SSI-UPC algorithm for test setup 9. 10 global modes were estimated and can be seen in the Mode List in the lower right corner. The torsional mode at 1.447 Hz is presented in the Geometry Window and Complexity Plot. The Modal Assurance Criterion (MAC) of all the global modes is also shown.
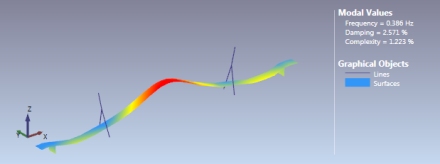
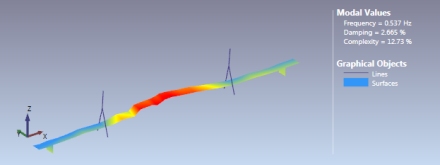
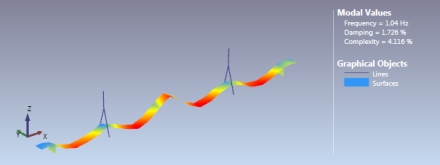
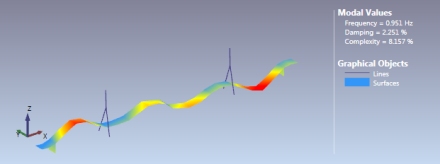
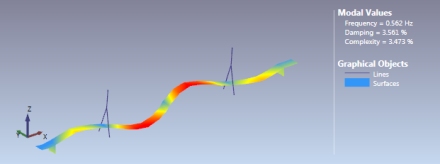
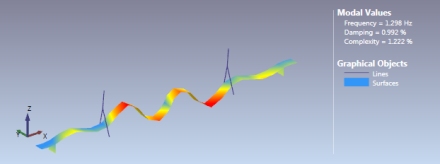
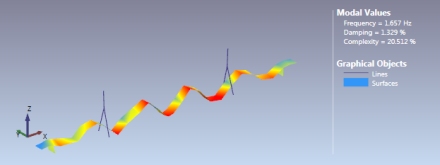
Below, the mode shapes of all 10 global modes are presented. The second mode is a weakly excited transverse mode which is affected by measurement noise. The remaining nine modes are of good quality as seen below.
F. Magalhães, E. Caetano, A. Cunha:
Challenges in Application of Stochastic Modal Idenfication Methods to a Cable-Stayed Bridge.
ASCE Journal of Bridge Engineering, November/December 2007.
Palle Andersen
Managing Director, Ph.D.
Niels Jernes Vej 10
9220 Aalborg East, Denmark
