The information described in this case study is by courtesy of the European research projects “Integrated European Industrial Risk Reduction System (IRIS)” and “Internet based Structural Monitoring System (ISMS)”. Special thanks to H. Wenzel (VCE), M. Döhler (Inria), L. Mevel (Inria) and C.E. Ventura (UBC).
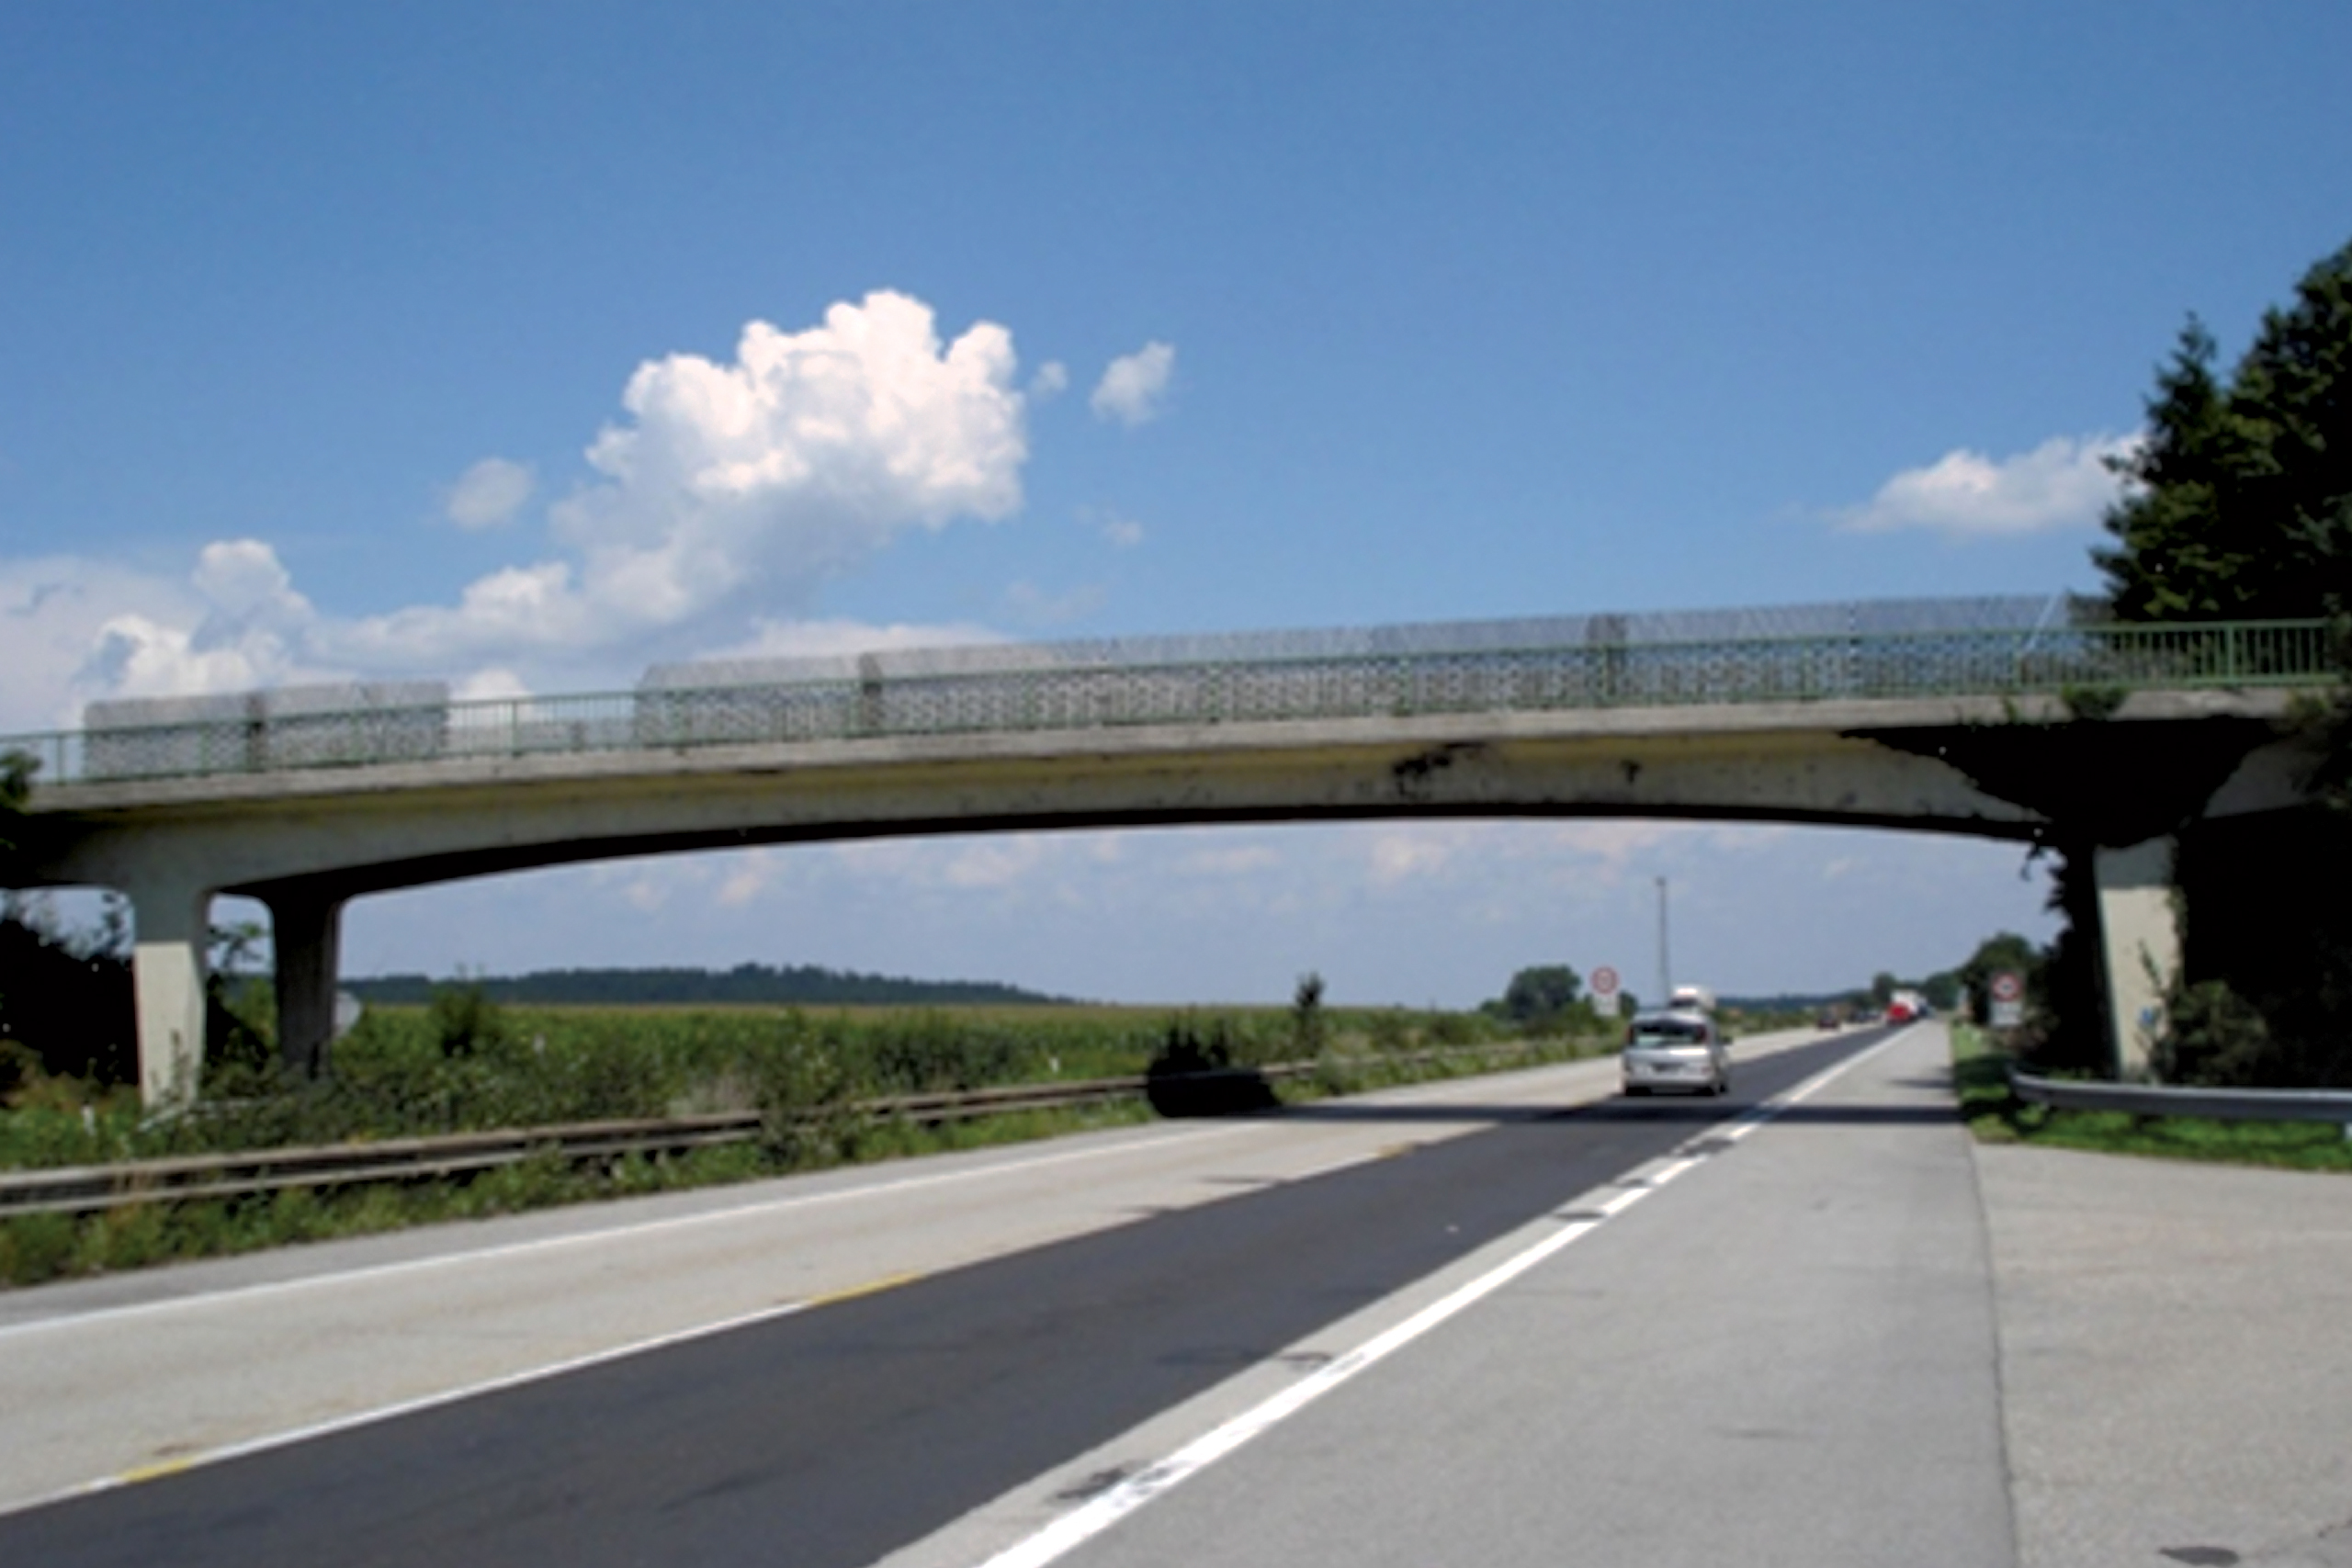
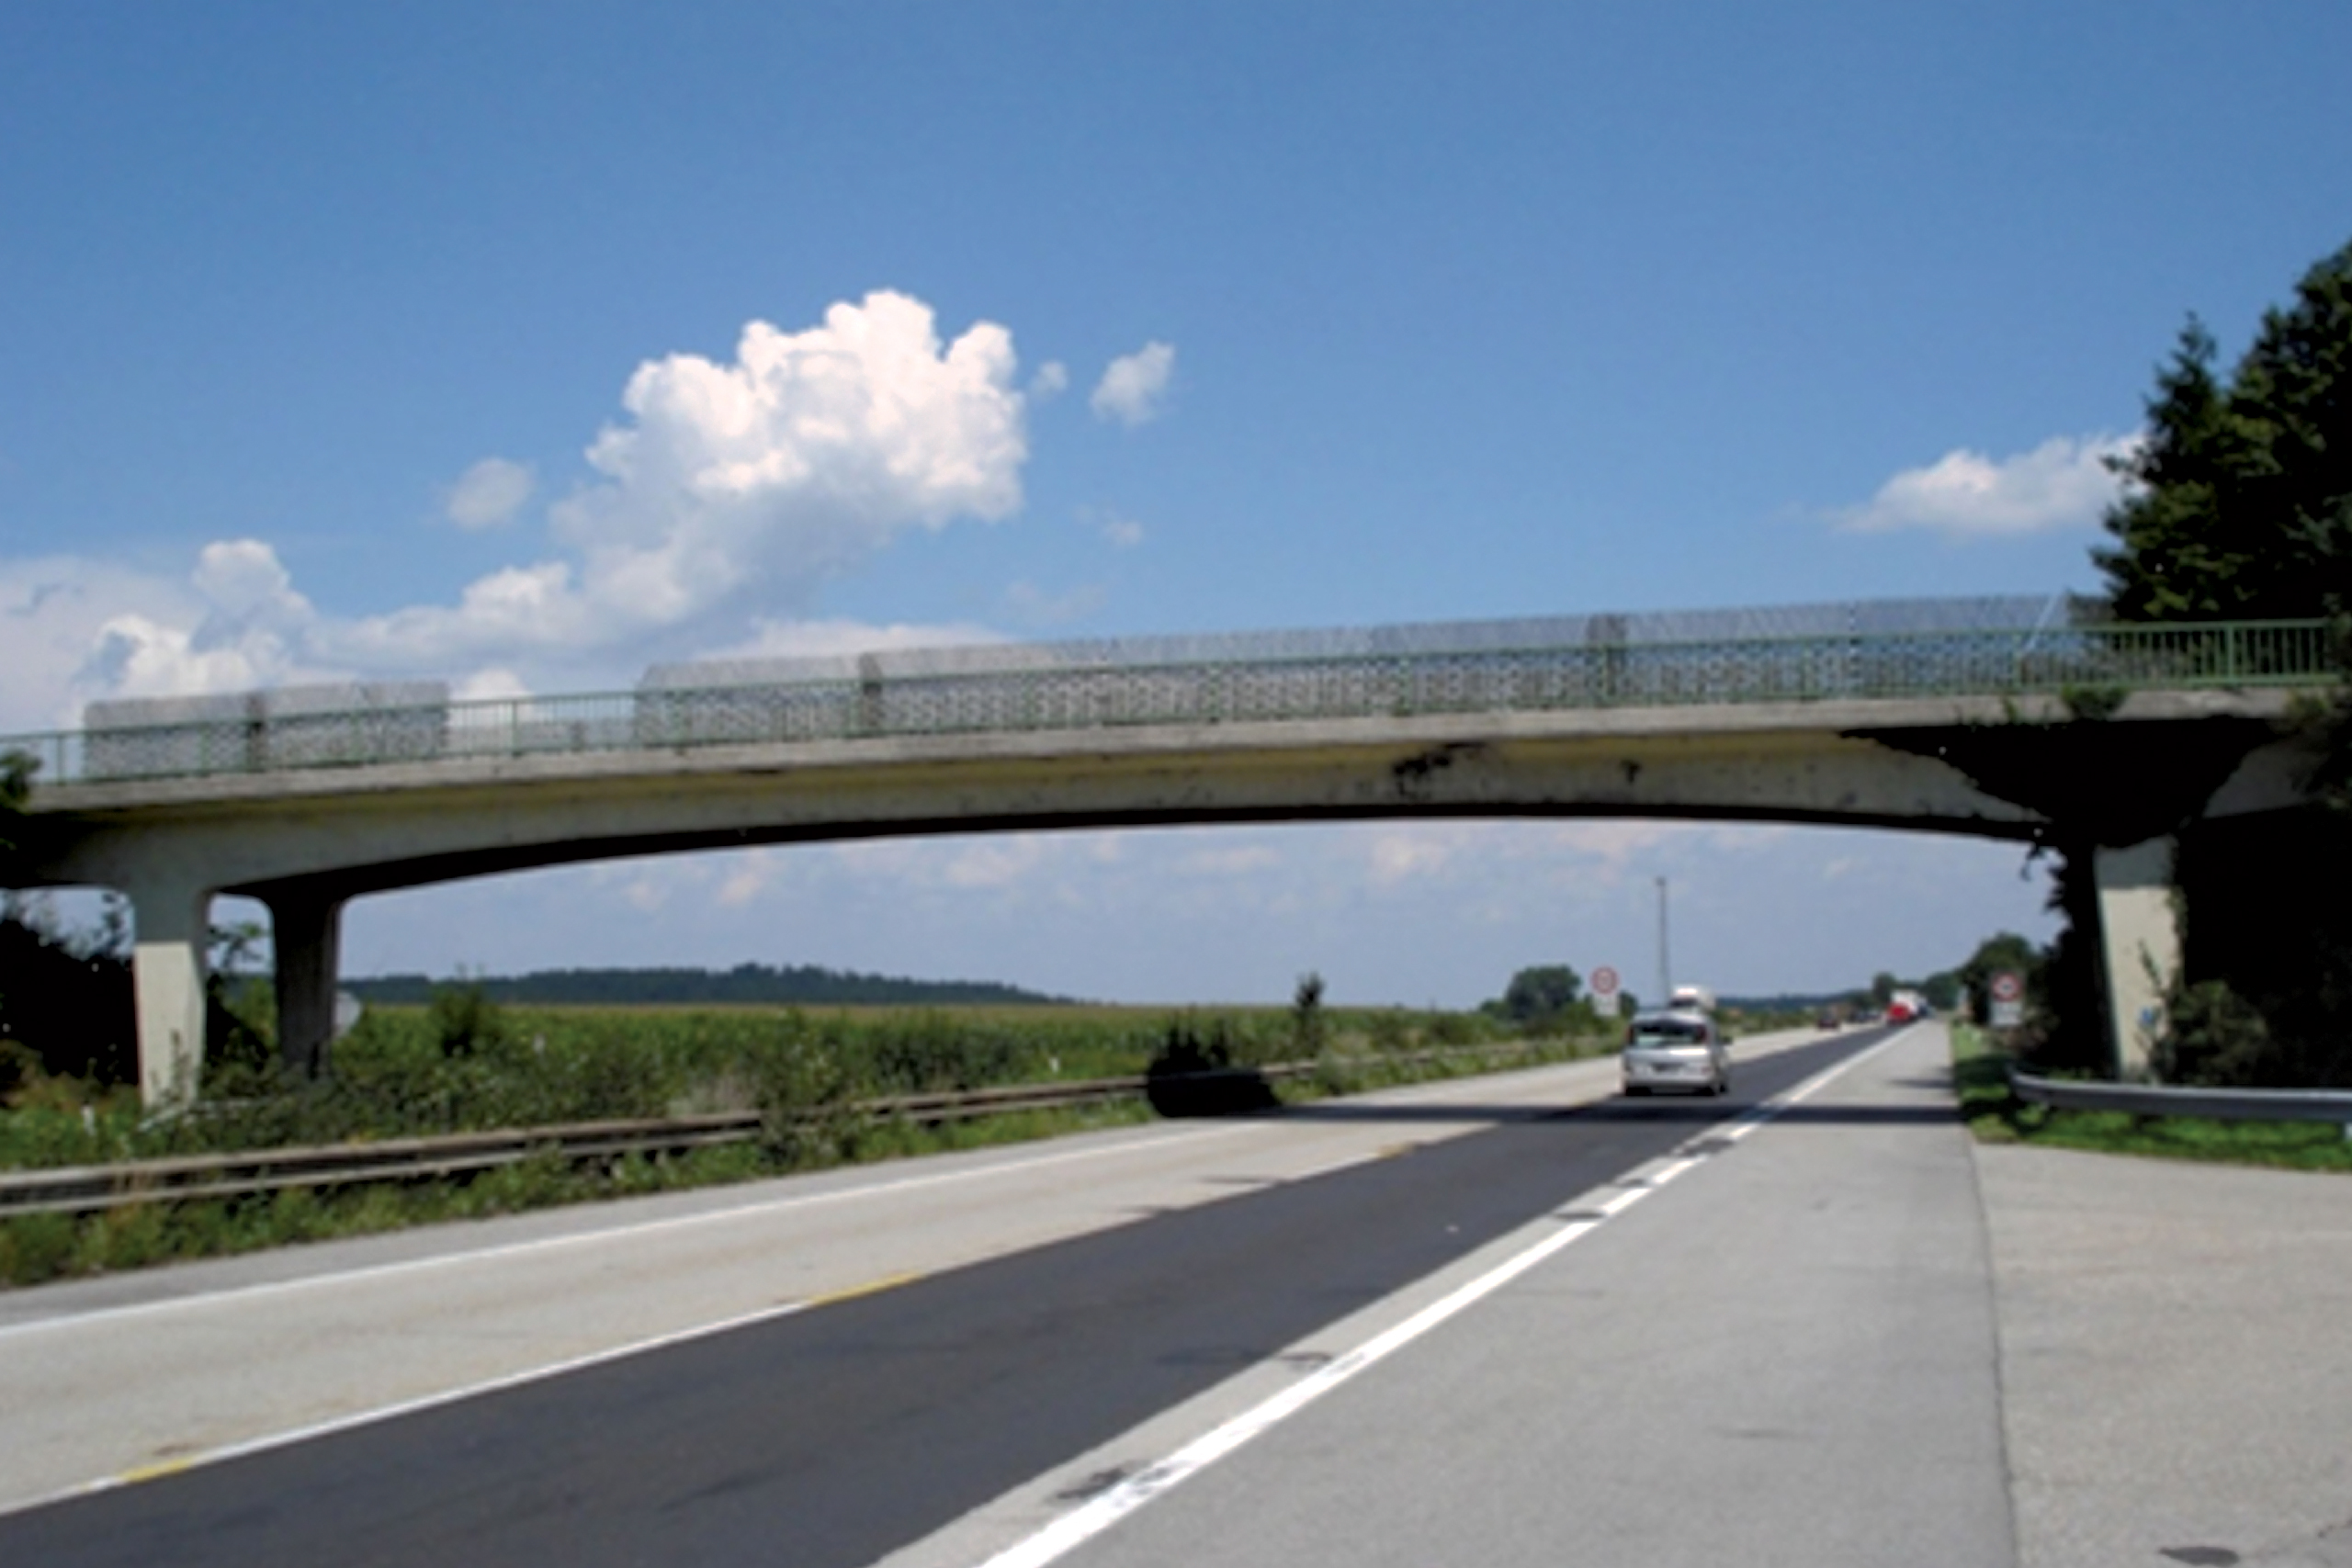
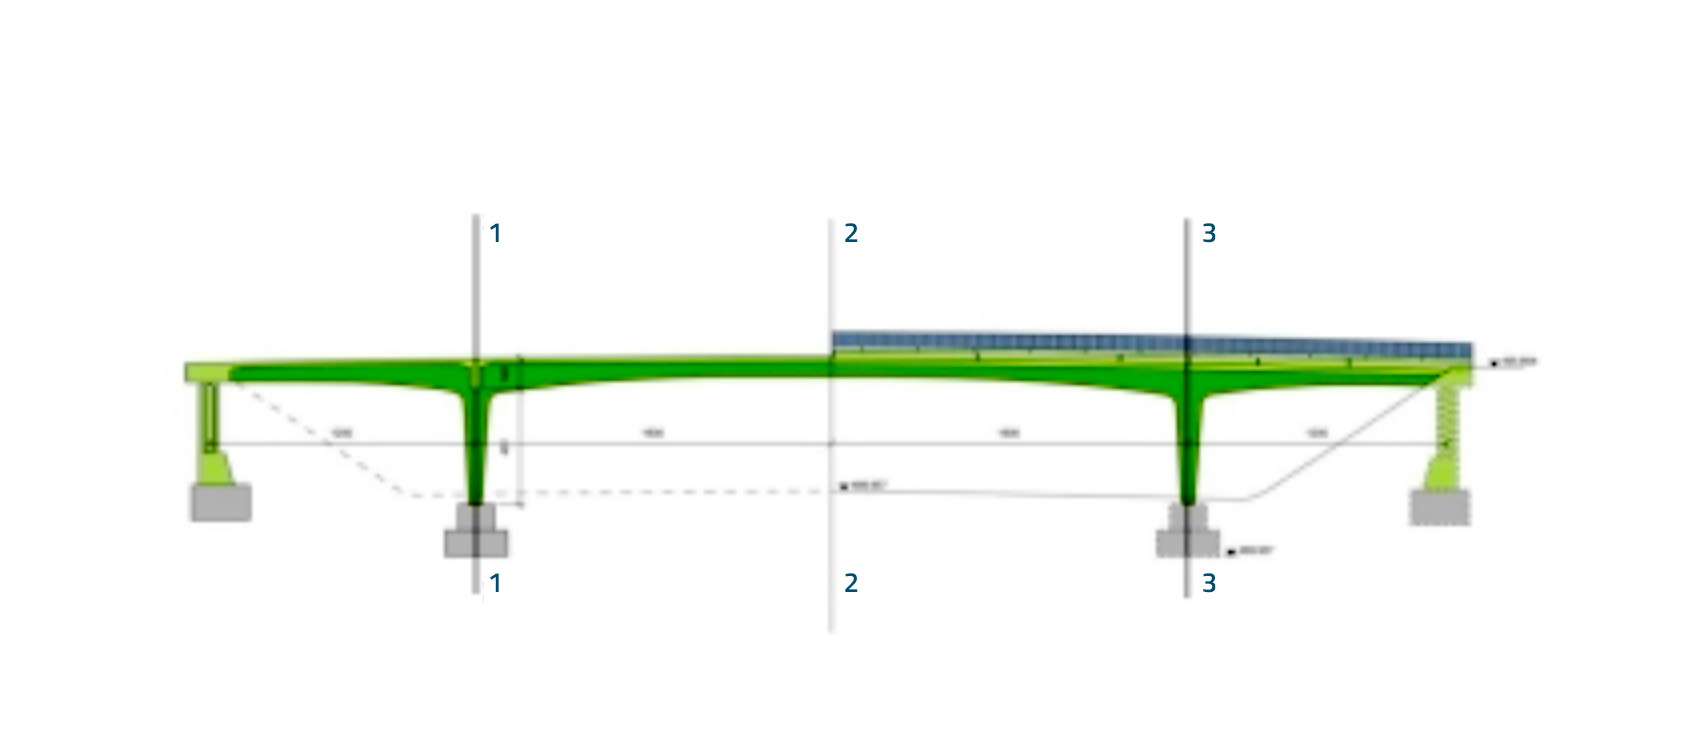
The bridge crossed the national highway A1 Westautobahn Austria. It is a post-tensioned concrete bridge with a main span of 32 m, side spans of 12 m, and a width of 6.6 m. The deck is continuous over the piers and is built into the abutments. The bridge, built in 1960, had to be demolished due to some structural problems and to allow some space for additional lanes of the highway underneath.
Within the IRIS project, the bridge was artificially damaged in various ways. The damaging processes were accompanied by a permanent measurement of the static and dynamic behavior of the structure. Within the IRIS and the ISMS project, the acquired dynamic measurements have been used to validate the developed damage detection and damage localization techniques.
The first objective of this first chapter is to describe the Operational Modal Analysis made in the reference state measurement performed before any damages were introduced. In the next objective we will look at the results of the damage detection.
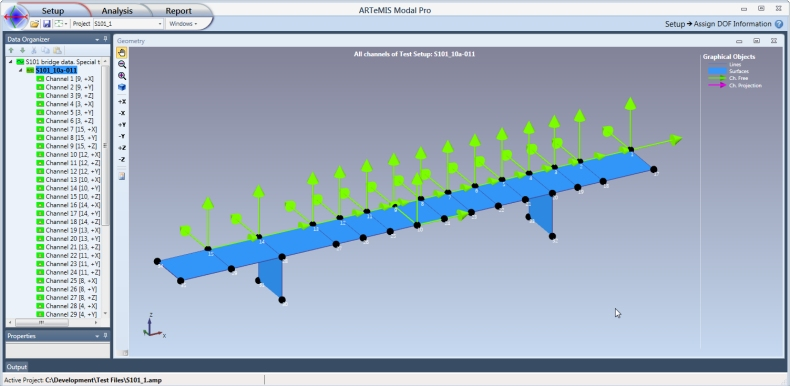
The measurements were carried out by VCE and the University of Tokyo on December 10-13, 2008. The data acquisition system had 45 channels. The record length used in the present analysis was 1,815,009 samples acquired at 500 Hz. Total measurement time used in the analysis is as such just above one hour. All accelerometers were placed on the girder. Below the measurement setup can be viewed. The input configuration file was prepared by Prof. C.E. Ventura, UBC.
The measurements were decimated from the original Nyquist frequency of 250 Hz to 25 Hz. The Automatic Projection Channel option was used, and it found 4 projection channels that in the following diagrams are highlighted in a magenta color. The Singular Values of the spectral densities reveal several distinct modes as seen below.
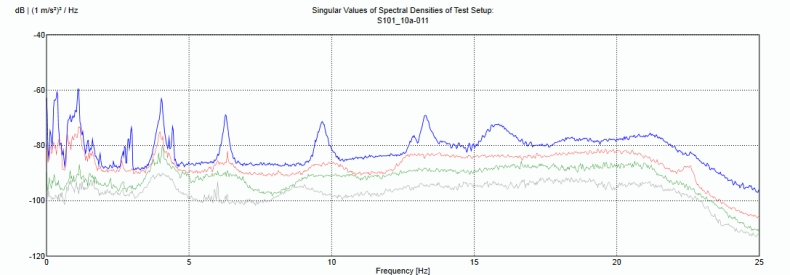
A quick analysis using the Enhanced Frequency Domain Decomposition method was used to get a “feeling” of what the measurements contained. It showed at least 5 distinct modes. After this the wokhorse of ARTeMIS Modal Pro – Crystal Clear SSI – was used with automatic settings. The Crystal Clear SSI was developed in 2010 in cooperation with the I4S Team at Inria. The stabilization diagram as well as the 6 modes the method found can be seen below.
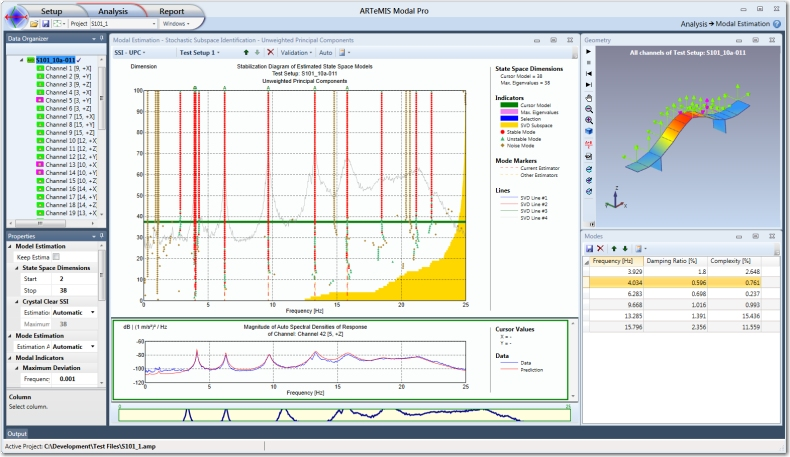
Additional modes were identified, but were discarted due to too high Modal Complexity and unrealistic high damping.
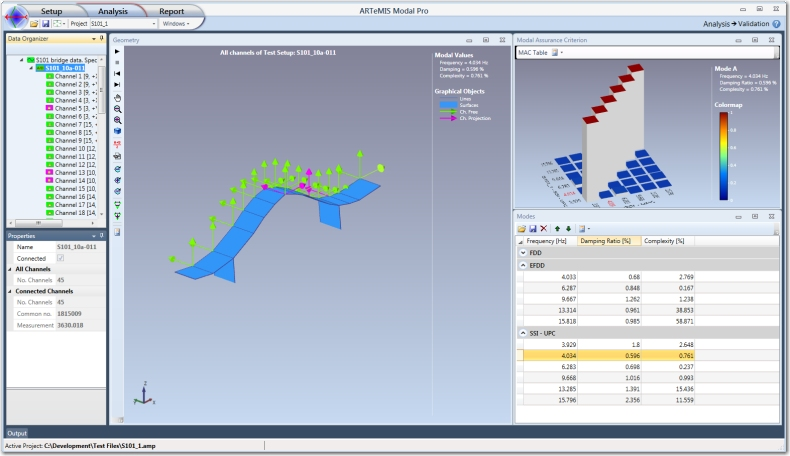
The six modes of Crystal Clear SSI were validated against each other, and as seen below the Modal Assurance Criterion as well as the Modal Complexity show low correlation and low complexity.
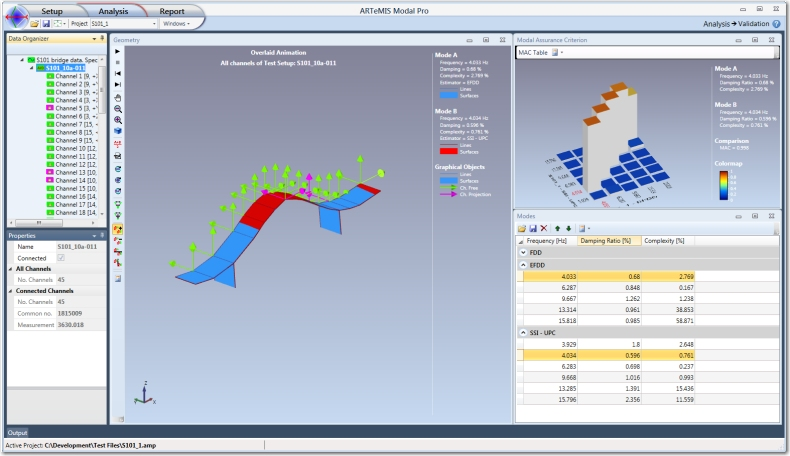
The results were also validated by looking at the Cross Modal Assurance Criterion between Enhanced Frequency Domain Decomposition (EFDD) and Crystal Clear SSI (SSI-UPC). Here the superiority of SSI-UPC is revealed as EFDD is unable to find the first transverse mode and, in general, has a higher complexity for the high order modes. The cross validation is seen below.
The complete analysis, from data upload started to results were ready, took approx. 1 hour. The six modes are shown below and can be downloaded here in Universal File Format.


The objective of this part of the case study is to demonstrates the use of the Damage Detection plug-in developed for the ARTeMIS Modal Pro Software.

Within the IRIS project, the bridge was artificially damaged in various ways. The damaging processes – listed above to the right – were accompanied by a permanent measurement of the static and dynamic behavior of the structure. The measurements were carried out by VCE and the University of Tokyo on December 10-13, 2008. The data acquisition system had 45 channels. Measurement records were dumped continuously, and each file contained 165,000 samples. In total, this case study consists of 689 of these records. Within the IRIS and the ISMS project, the acquired dynamic measurements have been used to validate the developed damage detection and damage localization techniques.
For a long time, the trend has been to check the health of a structure by comparing modal parameters obtained in a reference state with the modal parameters of a potentially damaged state. This works when a potential damage is causing changes in the normally few modes extracted. However, there might be modes that are affected by a damage, but not easy to extract. The Statistical Subspace-based Damage Detection feature tries to overcome this potential shortcoming of the explicit modal analysis. The major benefits of the new feature are:
No modal parameter estimation necessary.
The full dynamic system is compared implicitly instead of comparing a few modes.
Robust estimation in case of differences in vibration level from measurement to measurement.
Easy comparison – Simply upload a measurement file and get the damage index without further interaction.
Can integrate with existing monitoring systems or operated using the well-known ARTeMIS Modal user interface.
The Statistical Subspace-based Damage Detection procedure consists of the following steps:
Upload a set of measurement files acquired in a reference “undamaged” state of the structure.
Estimate a Reference State Model as an average of the dynamic behavior of the uploaded measurement files.
Test all individual measurement files of the reference state with the Reference State Model using Chi-Square testing. The outcome is a single Chi-Square value per measurement file. Use these values to establish an empirical Threshold for Chi-Square values being inside the undamaged Safe Zone.
Upload measurement files of the potentially damaged structure and test against the Reference State Model using Chi-Square testing. If the estimated Chi-Square values exceed the threshold, it indicates a significant change of the dynamics of the structure being measured, and as such a potential damage.
In the case of the S101 bridge, a Reference State Model was constructed using the first 100 measurement files. These were acquired on the first day before the damaging process started. All 689 files were then uploaded one by one and tested against the Reference State Model.
Below, the results are presented in a bar diagram where all green bars represent measurements having Chi-Square values inside the threshold (Safe Zone) – the horizontal red line. The measurements used to establish the Reference State Model are highlighted with a gray background to the left of the diagram. When Chi-Square values exceed the threshold, the bars are colored red (Unsafe Zone). The start of the 11 progressive damage scenarios is also indicated with annotations in the top of the diagram.
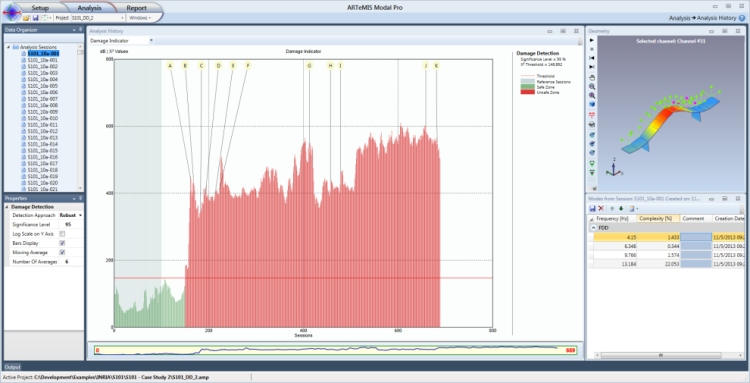
As it appears from the diagram, the indicator reacts dramatically when the first damage is being introduced at the measurement (Session) indicated with the annotation A.
Having the results of all measurement records in a single project makes it much easier to present the historical development of the dynamic behavior of a structure being monitored. As the base for all SHM plugins in ARTeMIS Modal Pro, an Analysis History Task is introduced, see the above picture. The primary purpose of this task is to display results as a function of the Analysis Session.
Specifically for this case study, the Analysis History Task is used to present a Damage Indicator as a function of the 689 measurement records, each stored in an Analysis Session. Each Analysis Session is stored in a dedicated file with the extension *.amps. These files are located in an external storage specified by the user. It can be anywhere on the users network.
M. Döhler, P. Andersen, L. Mevel:
Operational Modal Analysis using a Fast Stochastic Subspace Identification Method.
Proceedings of the 30th International Modal Analysis Conference (IMAC) Jacksonville, Florida USA, 2012.
M. Döhler, L. Mevel:
Fast multi-order computation of system matrices in subspace-based system identification.
Control Engineering Practice, 20(9):882-894, 2012.
Wenzel, H. et al.:
FP7-NMP-2007-LARGE-1 (IRIS) WP3 Demonstration Report, 2009
M. Döhler, F. Hille, X.B. Lam, L. Mevel, W. Rücker:
Confidence Intervals of Modal Parameters During Progressive Damage Test.
Proceedings of the 29th International Modal Analysis Conference (IMAC) Jacksonville, Florida USA, 2011.
Palle Andersen
Managing Director, Ph.D.
Niels Jernes Vej 10
9220 Aalborg East, Denmark
