Search
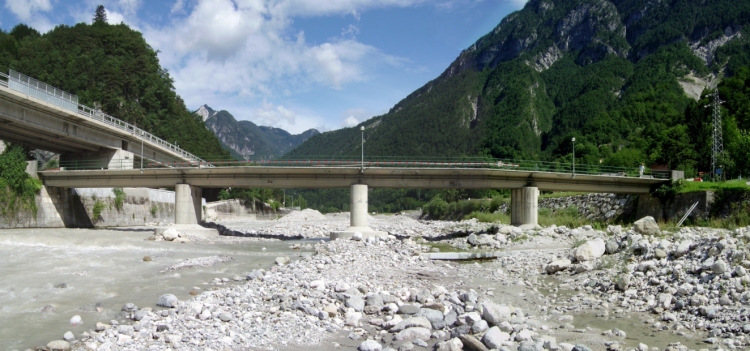
The Dogna bridge crosses the River Fella and connects the villages of Crivera and Valdogna (Dogna) in Friuli Venezia Giulia, a region located in the North East of Italy.
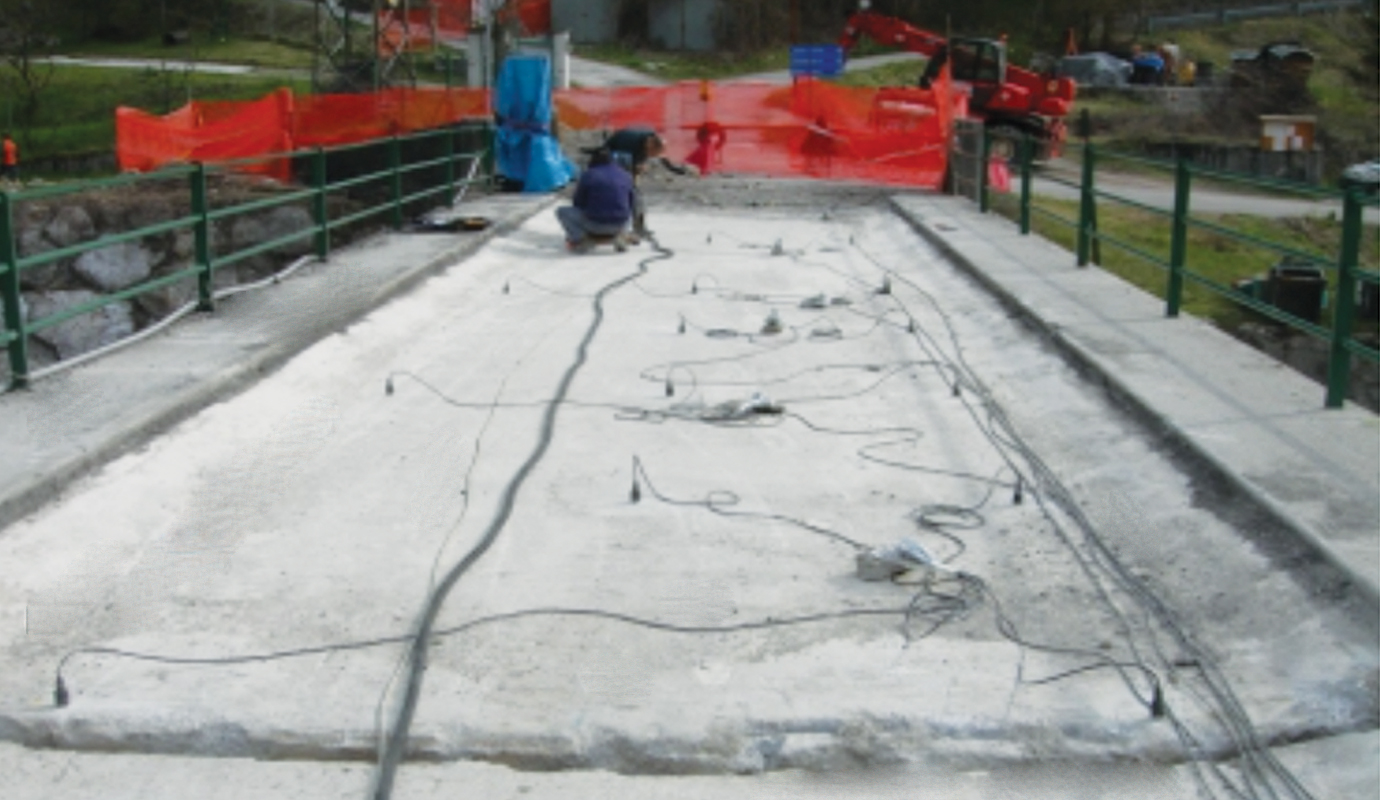
Figure 1: The Dogna bridge crossing the River Fella.
This case study presents a novel application of the Damage Detection plugin available in ARTeMIS Modal Pro. It shows how the plugin is used with measurements obtained from the Dogna bridge in Italy in the spring of 2008 by Professor Morassi of the Dipartimento di Ingegneria Civile e Architettura at the Università degli Studi di Udine, Italy, and Professor Benedettini of the Dipartimento di Ingegneria Civile, Edile-Architettura e Ambientale at the Università degli studi dell’Aquila, Italy. Structural Vibration Solutions A/S gratefully acknowledges both professors for their help with this case study and for sharing the measurements, photos and relevant information about this bridge.
As shown in Figure 1, the bridge is a four-span, single-lane concrete bridge. The length of each span is 16 m, and the lane is about 4 m width. The bridge deck is made of a reinforced concrete (RC) slab 0.18 m thick, supported by three longitudinal RC beams with a rectangular cross-section 0.35 x 1.20 m. The beams are simply supported and rest at the ends on thin metallic sheets.They are connected at the supports, at midspan and at span quarters with rectangular cross-section RC diaphragms (0.3 x 0.7 m). Each pier is a RC wall about 1.5 m thick, 4.5 m deep, and around 3.6 m high. The abutments consist of RC walls, 1 m thick. Piers and abutments were built on cast-in-place concrete piles of 1 m in diameter and 18 m in length.
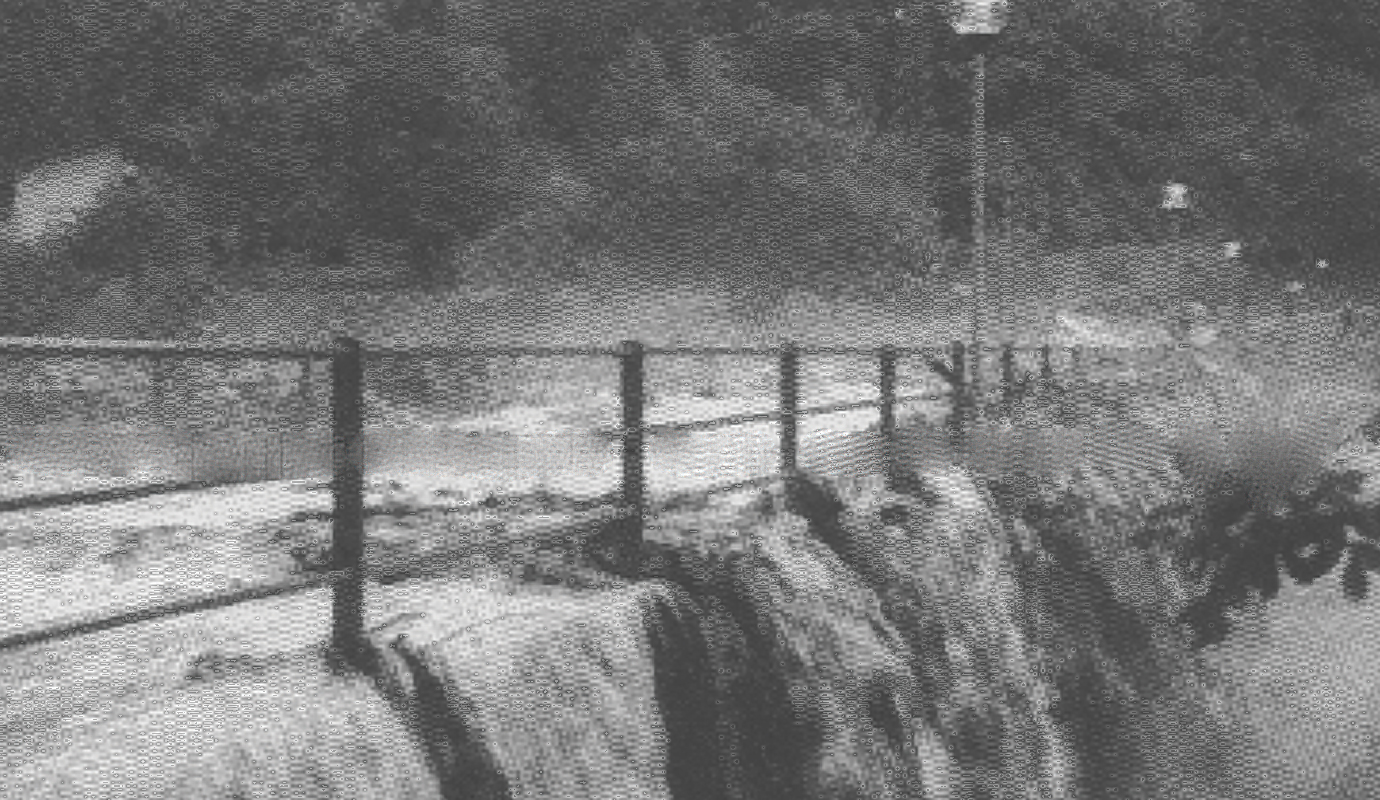
On August 31, 2003 the bridge suffered severely due to an exceptional flood of the Fella River. At that time, due to the material deposited upstream, the deck structures of the bridge were overtop by the flow of the water as seen in the pictures below.

A visual inspection conducted on the bridge revealed no apparent deterioration of the slab and beams, whereas a state of degradation was noticed on support bearing side pier. For traffic safety reasons, the Dogna bridge was demolished on May 2008 and has been replaced by a new bridge built about 200 m downstream.
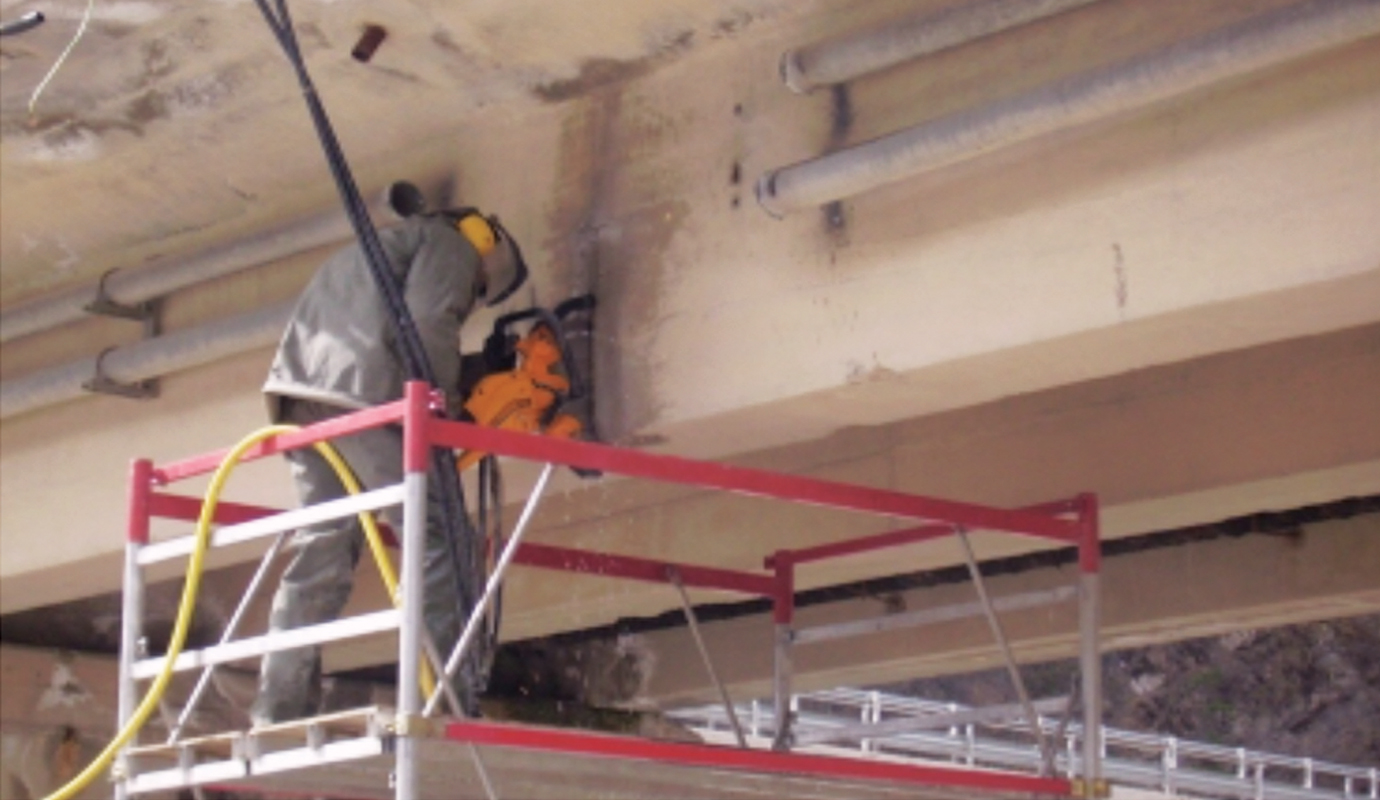
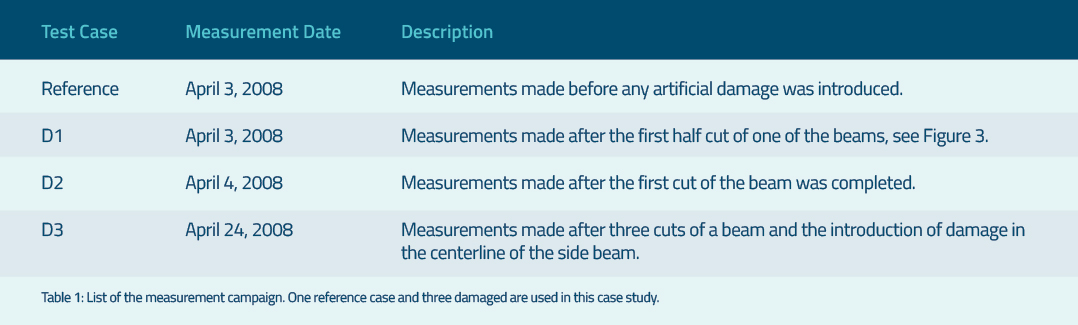
A testing campaign was carried out from April 2 to April 11, 2008 and consisted of a series of tests of progressive damage of one of the bridge spans. The tested span was made independent of the adjacent span by removing the deck-joint of the pier. Moreover, the asphalt overlay of about 0.1 m thickness was also removed before testing. All the tests were carried out under similar environmental and weather conditions so that the influence of temperature and humidity on the dynamic modal parameters would not be a factor of significant importance. Figure 3 shows the bridge span during the tests and how the progressive damage was introduced artificially.
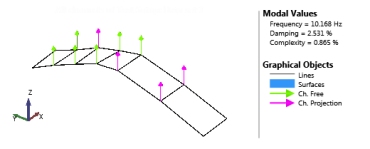
Before the progressive damage was introduced artificially, a reference Ambient Vibration Test was conducted for 20 minutes in 10 locations on the bridge span. The total number of samples acquired was 475341. The figure 4 below shows the first four modes of the structure.
Figure 4: First 4 fundamental modes of the bridge span.
In order to establish the thresholds for being inside the safe zone, the damage detection plugin needs multiple files that ultimately result in multiple indicator values. In order to accomplish this, the undamaged measurement record was divided into eight separate measurement files. The six first were then used to create the reference state model, and the remaining two were used to validate the performance of the reference state model.
The following describes the steps required to establish the reference state (baseline) model.
Define a new External Storage ARTeMIS Modal project using e.g. the interactive setup tools or from a SVS Configuration File. Here the configuration file used previously for the above Operational Modal Analysis was re-used by replacing the original undamaged measurement file with the first of the eight subdivided measurement files.
In ARTeMIS Modal Pro, measurements and associated results are stored as Analysis Sessions. This allows the storage and presentation of historical development of the results obtained from different measurements. Each time a measurement is uploaded, ARTeMIS Modal Pro will create a new Analysis Session and associate it to the uploaded measurement. The Signal Processing dialog in the Prepare Data task is used to configure how the uploaded measurements for this first Analysis Session should be processed. Here we chose to decimate the measurements and end up selecting this initial Analysis Session as the Master Session. The parameters in the Master Session are used for all other Analysis Sessions that will be created in the project.
The remaining seven reference measurement files are then uploaded. By switching to the Analysis History task, the uploading of the files can be done simply by dragging them from the Windows Explorer to the Analysis History window. The files are then automatically uploaded and processed. In Figure 5 below, the top left picture shows the list of reference Analysis Sessions. The green check mark indicates that the signal processing is complete for each session.
When all the reference measurements are uploaded and processed, it is possible to configure how the damage detection algorithms should estimate the reference state model. In Figure 5, the Damage Detection configuration dialog is shown. In this dialog, the Start and End Reference Analysis Sessions are selected as the first six out of the eight, and the Start button is pressed. This will create the reference state model, the statistical thresholds and damage indicators of the eight reference measurements, see Figure 6.
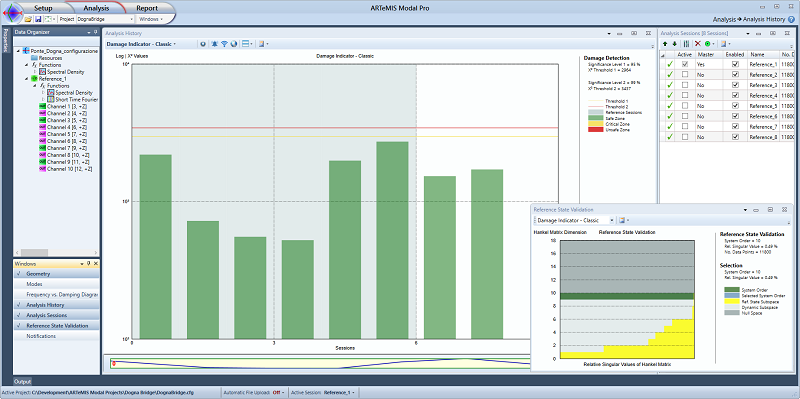
Figure 5: Establishing the reference state model. It consists of the six measurements uploaded and stored in their own Analysis Sessions. In the Analysis History task window, the Damage Detection configuration dialog is used to select the range of Analysis Sessions to use measurements from in the reference state model. Once established, the Chi Square damage indicators of each of the six reference measurements are calculated and used to estimate the Safe-Zone and Critical-Zone thresholds.
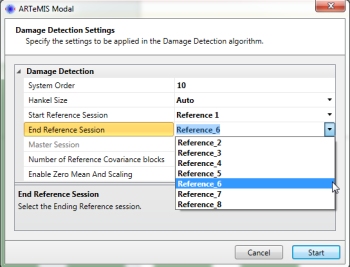
Figure 6: Once the reference state model and thresholds are estimated, all uploaded measurements are presented by the damage indicators. Here the six first inside the gray zone are the ones used to establish the reference state model, and the remaining two are used to validate that new data from the same reference state is actually within the safe zone as well. In addition, it is possible to investigate the null space estimation of the reference state model. In the diagram called Reference State Validation, singular values of the null space are presented as the upper dark-gray zone. The singular values should preferably be zero in this region, which is the case here, where no yellow singular values can be seen above the indicator of the selected system order.
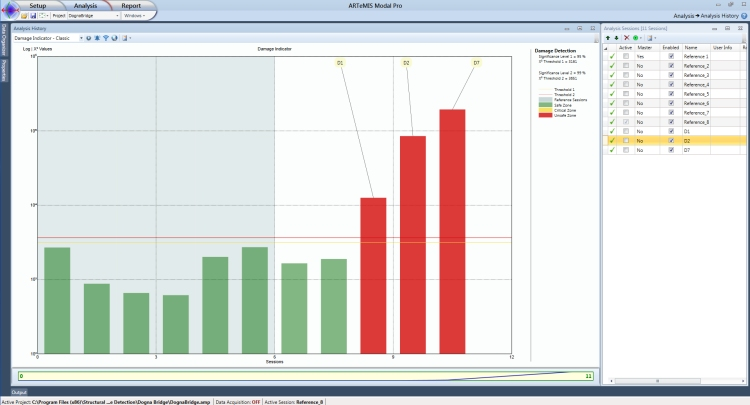
Once the Reference State Model has been estimated along with the thresholds, it is a simple matter to test the three damage cases presented in Table 1. The measurement files for each of the damage cases are simply dragged from the Windows Explorer to the Analysis History window that will process them automatically and present the associated damage indicators. If there is a significant change of the dynamics, the indicators will pass the thresholds. Changes in the dynamics of the structure beyond the threshold levels will be shown as red colored bars on the chart. Larger bars indicate very significant changes on the structural system which can be related to damage of the structure. In Figure 7 below, the indicators are shown for the three damage cases, and they all indicate a significant change of the dynamic behavior of the structure. Also, it is clear that the damage is increasing from the first to the last damage case, as expected.
Figure 7: All damage indicators presented. The first 8 green ones are from the reference (undamaged) measurements and the last three red ones are from the three cases of progressive damage, D1, D2 and D7.
This case study demonstrates the use of the Damage Detection plugin in ARTeMIS Modal Pro. A reference state model is constructed from uploading a series of measurement files all describing the reference state of the structure. Once the reference state model is constructed, damage detection is performed simply by dragging measurement files, acquired from the potentially damaged structure, into the Analysis History window. The damage indicators are then automatically calculated and presented either in green (safe state), yellow (critical state) or red (unsafe state).
M. Döhler and F. Hille: Subspace-based damage detection on steel frame structure under changing excitation. Proc. 32th International Modal Analysis Conference (IMAC) Orlando, Florida USA, 2014.
F. Benedettini, A. Morassi: Dynamic testing, structural identification and damage detection on Dogna’s bridge. Proceedings of the 8th International Conference on Structural Dynamics, EURODYN 2011, Leuven, Belgium, 2011.
M. Dilena, A. Morassi , M. Perin: Dynamic identification of a reinforced concrete damaged bridge. Mechanical Systems and Signal Processing, 2011.
M. Dilena, A. Morassi: Dynamic testing of a damaged bridge. Mechanical Systems and Signal Processing, 2011.
M. Dilena, M.P. Limongelli, A. Morassi: Damage localization in bridges via FRF interpolation methods. Mechanical Systems and Signal Processing, 2014.
M. Döhler, L. Mevel, and F. Hille: Subspace-based damage detection under changes in the ambient excitation statistics. Proc. 18th IFAC World Congress, Milan, Italy, 2011.
F. Hille, M. Döhler, L. Mevel and W. Rücker: Subspace based damage detection methods on a prestressed concrete bridge. Proc. 8th Int. Conf. on Structural Dynamics EURODYN, Belgium, 2011
Palle Andersen
Managing Director, Ph.D.
Niels Jernes Vej 10
9220 Aalborg East, Denmark