The idea of the Frequency Domain Decomposition (FDD) technique is to perform an approximate decomposition of the system response into a set of independent single degree of freedom (SDOF) systems, one for each mode. The theory is described in R. Brincker, L. Zhang and P. Andersen: Modal Identification from Ambient Responses using Frequency Domain Decomposition. Proc. of the 18th International Modal Analysis Conference (IMAC), San Antonio, Texas, 2000.
The decomposition is performed simply by decomposing each of the estimated spectral density matrices. In the above reference it is shown that the singular values are estimates of the auto spectral density of the SDOF systems in modal coordinates, and in the vicinity of the resonance peak the singular vectors are estimates of the mode shapes of the mode.
The FDD technique involves the main steps listed below:
- Estimate spectral density matrices from the raw time series data.
- Perform singular value decomposition of the spectral density matrices.
- If multiple test setups are available, then average the first singular value of all test setups and average the second etc.
- Peak pick on the average singular values. For well-separated modes always pick on the first singular value. In case of close or repeated modes, pick on the second singular value, the third singular value etc. as well.
- Optionally, if multiple test setups are available, inspect the singular values of each test setup and edit the peak picking position if necessary.
The first three steps are performed automatically when the data is processed in the Prepare Data Task. The last steps require your input and are done using the Modal Estimation window. The technique is a completely non-parametric technique where the modes are estimated purely by signal processing.
In the case of the Plate with Harmonics example the Modal Estimation window looks as below right after the signal processing of the data is complete:
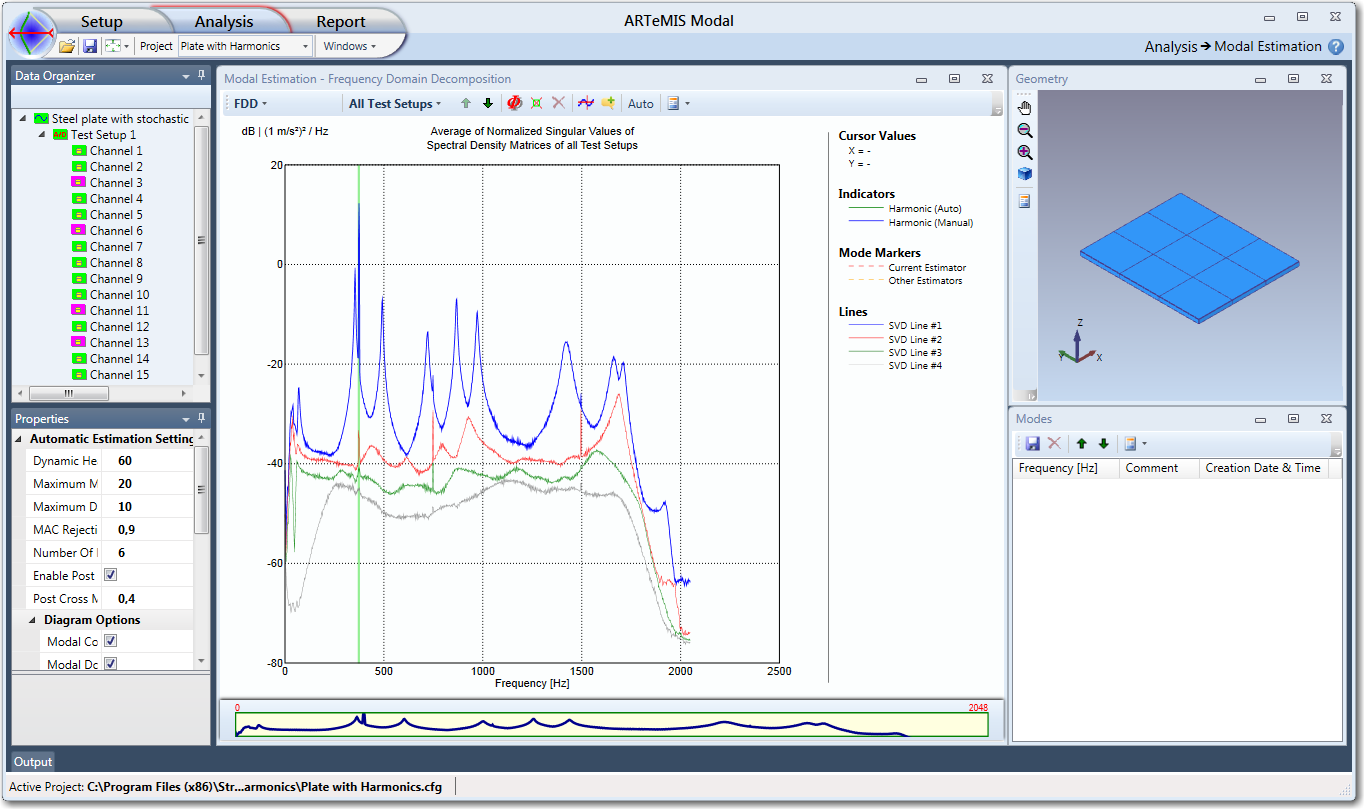
In this case the Harmonic Detection has been enabled since the measurements also includes deterministic signals from a sinusoidal excitation source. A harmonic peak is indicated at 374 Hz with a vertical green area behind the peak.
Modal Estimation using Frequency Domain Decomposition
The Modal Estimation window displays the singular values of the spectral density matrices. If multiple Test Setups are present the singular values calculated for each Test Setup have been averaged to obtain the displayed curves. In the present example there is one Test Setup with 16 channels, and in order to obtain the presented four curves the 16x4 dimensional spectral density matrices of Test Setup 1 have been estimated. It only has four columns since there is only four Projection Channels selected in the Prepare Data Task.
Estimating a New Well-Separated Mode
You can estimate a mode either manual by clicking the Add New Mode button  or use the Automatic Mode Estimation feature by clicking the
  . If you use the manual a blue cross that snaps to the nearest point of the singular value curves as shown below:
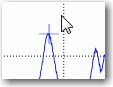
The cross snaps on the peak nearest to the mouse cursor. In the right-hand side legend the location of the cross is presented in terms of the frequency (X=) and singular value (Y=).
To estimate the mode at the peak where the cross is located simply double-click on the left mouse button. To abort the estimation press the <Esc> key instead. When the estimation is finished the vertical line lock itself on the frequency at the picked mode. Further, a green cross will appear instead of the blue cross to indicate which singular value the mode has been picked. Below the complete editor is shown after the estimation of the mode:
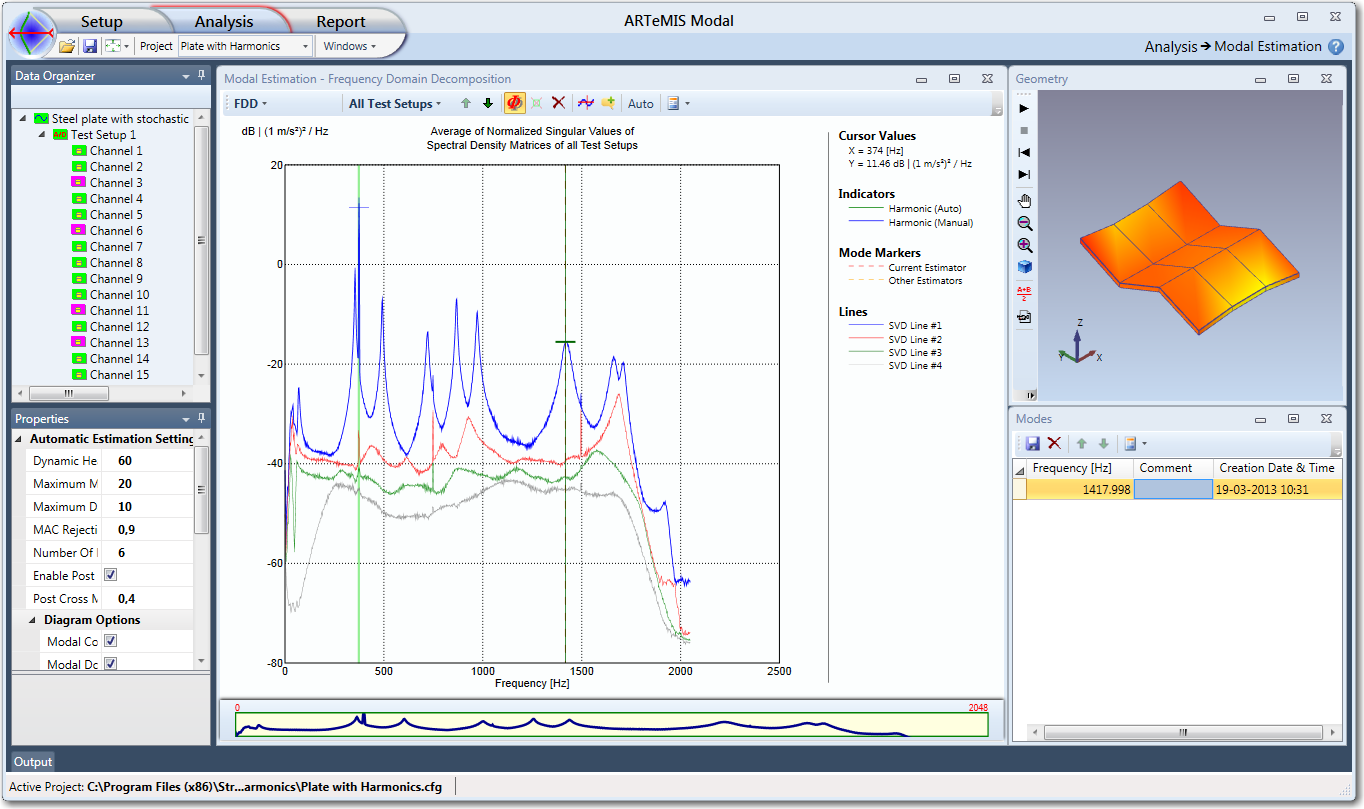
As seen the mode is now drawn in green and listed in the Mode List below. The mode remains drawn in green as long as it is selected. You can now immediately click the start animation  to inspect the estimated mode shape.
To pick another mode you simply double-click on a desired snap point. You can keep picking modes as long as the Add New Mode button is active.
Estimating Repeated Modes
If you have a system as the building model example with repeated modes, you might need to pick the modes on several singular value curves at the same frequency. This means that if you have two repeated modes you will have to pick them on the first and the second singular value curve. It also means that the maximum number of repeated modes that can be estimated is equal to the minimum number of either channels or Projection Channels in the Test Setups.
Estimating Closely Spaced Modes
There might also be situations where the modes are closely spaced as it is the case of the first bending modes in the building model example. In this case it might still be possible to pick the modes on the first singular values. However, the difference between being closely spaced and being repeated depends both on the actual system but also on the frequency resolution of the spectral density estimation.
When you pick the modes you should try to visualize that you are picking the individual modes on the top of their corresponding single degree of freedom (SDOF) spectral density bell function. If you can visualize that the bell of e.g. two modes have peaks on different frequencies then they are not repeated and can both be picked on the first singular value curve. If they have peaks at the same frequency you will have to pick them at different singular value curves instead. This is what the Enhanced Peak Picking take advantage of. It simply identifies these SDOF bell functions constructed from singular values.
Switching Between Average and Individual Singular Value Lines
Until now all operations relating to estimation of a mode has been performed using the averaged singular value display in the peak picking editor. As long as you use this display the same frequency and singular value will be used when the estimator picks out the singular vectors in the individual test setups. This way of estimating the modes are the easiest one and therefore also the most recommendable and it will work in most cases. However, sometimes you are forced to change either frequency and / or singular value in one or more test setups. This can happen if the frequency of the mode drifts a bit or if another mode suddenly become much more energetic. For this reason you can disable the average display and view the individual Test Setup instead. When you choose to display the singular value lines of the individual Test Setup it is always the lines of the currently selected test setup that is displayed.
Editing a Mode Already Estimated
You can always edit the currently selected (green) mode. You might want to adjust the frequency you are picking the mode on or selecting another singular value curve. The latter is applicable when dealing with closely spaced modes.
To activate the edit mode, start by selecting the mode you want to edit. Then click the edit mode button  that activates the edit mode which will stay active until you either press the button again or press the <ESC> key. When you press the left mouse button down and keep it down you will see a blue cross which snaps to a line and a green cursor which indicates the selected mode as shown below:
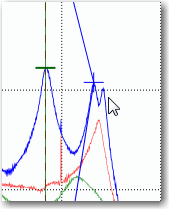
The green cross show which mode you are editing and the blue lines are drawn from the original position of the mode. The blue cross shows you the currently snapped position. If you release the mouse button the mode will move to this position and be re-estimated using the new frequency and singular value position.
Note: While you are displaying the average singular value lines the changes are reflected in all Test Setups. However, if you are editing while displaying the singular value
lines of an individual Test Setup only the frequency and singular value of this specific test setup is changed.
Deleting a Mode
You can always delete the currently selected (green) mode either by pressing the delete mode button  or in the context menu. For every mode you are deleting you are asked to confirm the deletion.
See Also